The Ivy Coach Daily
Previous Years Waitlist Acceptance Rates & Statistics For Ivy League Schools
Each year, at the end of March and early April, a group of students across the country and around the world learn that they’ve neither been accepted nor denied after the Regular Decision round to certain Ivy League schools to which they applied. Instead, they’ve been waitlisted. The schools that have placed them in limbo have essentially kicked the can on their admissions decision. So, do waitlisted students to Ivy League schools genuinely have a chance? And what exactly are their chances? Let’s dive in!
Ivy League Previous Years Waitlist Acceptance Rates & Statistics
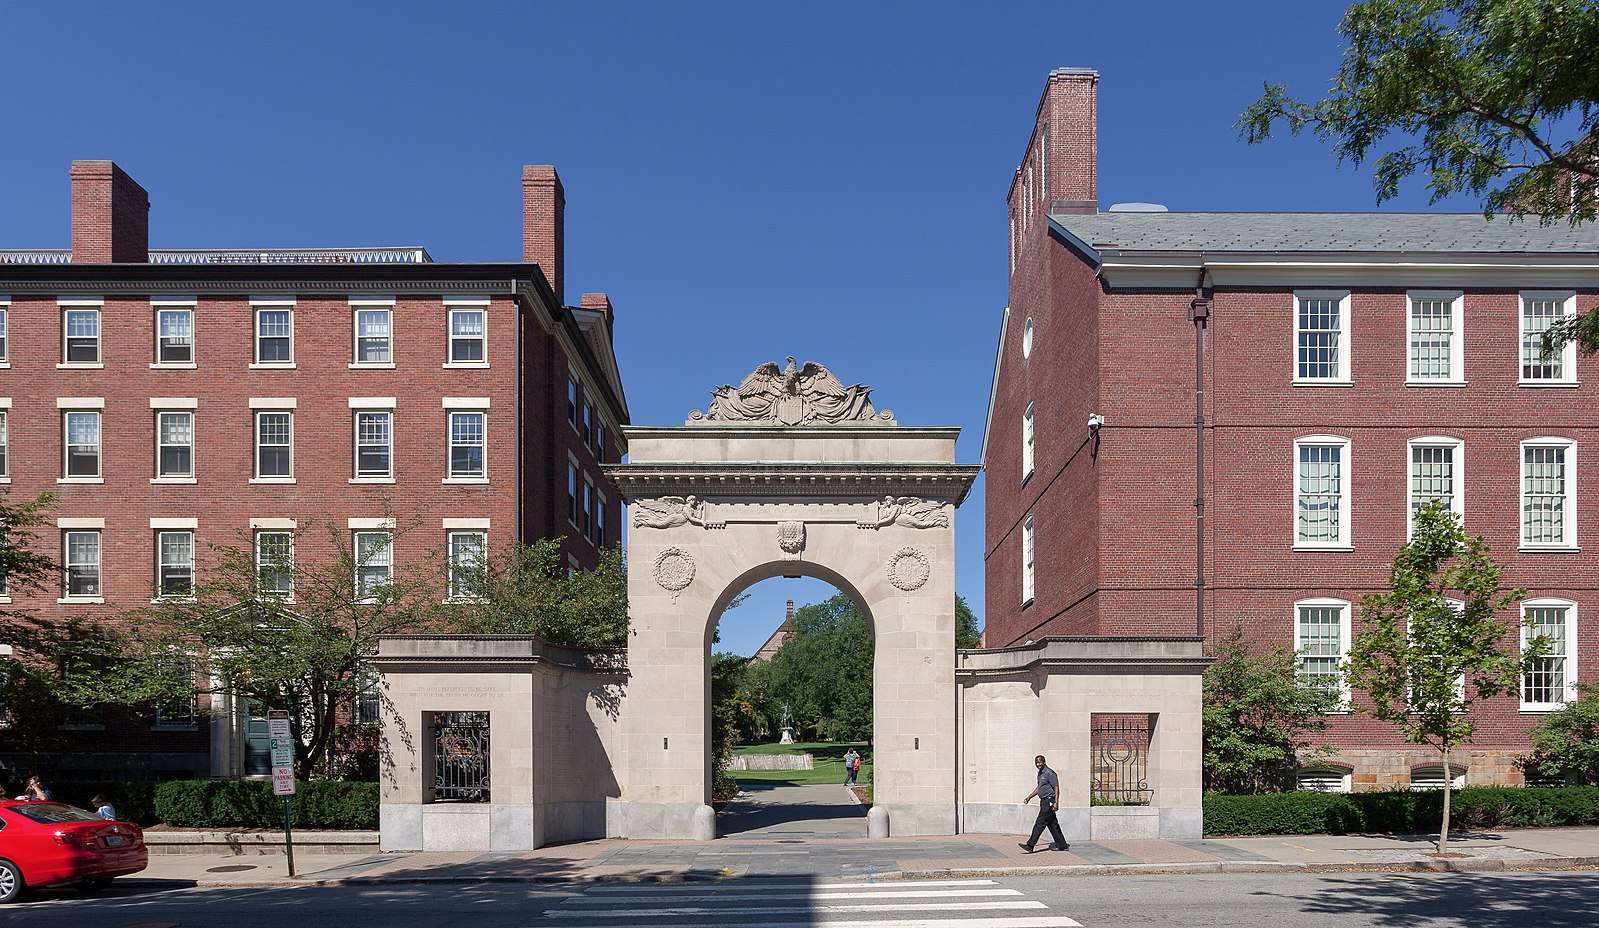
Brown University
At Brown University, since the Class of 2008, excluding years in which the school did not report sufficient waitlist data, the average waitlist acceptance rate has been 12.95%. In more recent years, since the Class of 2018, Brown has only reported the number of students accepted off its waitlist, which has averaged out to be approximately 120 students a year.
Below is a breakdown of Brown’s waitlist acceptance history:
| Brown University Class Year | Number of Students Waitlisted to Brown | Number of Students Who Chose to Join Brown Waitlist | Number of Students Accepted Off Brown Waitlist | Brown Waitlist Acceptance Rate |
| Brown Class of 2029 | TBD | TBD | TBD | TBD |
| Brown Class of 2028 | Not Yet Published | Not Yet Published | Not Yet Published | Not Yet Published |
| Brown Class of 2027 | Not Yet Published | Not Yet Published | Not Yet Published | Not Yet Published |
| Brown Class of 2026 | Not Reported | Not Reported | 15 | Not Reported |
| Brown Class of 2025 | Not Reported | Not Reported | Not Reported | Not Reported |
| Brown Class of 2024 | Not Reported | Not Reported | 194 | Not Reported |
| Brown Class of 2023 | Not Reported | Not Reported | 127 | Not Reported |
| Brown Class of 2022 | Not Reported | Not Reported | 100 | Not Reported |
| Brown Class of 2021 | Not Reported | Not Reported | 86 | Not Reported |
| Brown Class of 2020 | Not Reported | Not Reported | 82 | Not Reported |
| Brown Class of 2019 | Not Reported | Not Reported | 192 | Not Reported |
| Brown Class of 2018 | Not Reported | Not Reported | 57 | Not Reported |
| Brown Class of 2017 | Not Reported | Not Reported | Not Reported | Not Reported |
| Brown Class of 2016 | Not Reported | Not Reported | Not Reported | Not Reported |
| Brown Class of 2015 | Not Reported | Not Reported | Not Reported | Not Reported |
| Brown Class of 2014 | 1,550 | 600 | 32 | 5.33% |
| Brown Class of 2013 | 1,500 | 500 | 82 | 16.40% |
| Brown Class of 2012 | 1,400 | 450 | 68 | 15.11% |
| Brown Class of 2011 | 1,400 | 450 | 73 | 16.22% |
| Brown Class of 2010 | 1,983 | 450 | 35 | 7.78% |
| Brown Class of 2009 | 1,735 | 987 | 99 | 10.03% |
Columbia University
Below is a breakdown of Columbia’s waitlist acceptance history — or lack thereof since the school doesn’t release the data:
| Columbia University Class Year | Number of Students Waitlisted to Columbia | Number of Students Who Chose to Join Columbia Waitlist | Number of Students Accepted Off Columbia Waitlist | Columbia Waitlist Acceptance Rate |
| Columbia Class of 2029 | TBD | TBD | TBD | TBD |
| Columbia Class of 2028 | Not Published | Not Published | Not Published | Not Published |
| Columbia Class of 2027 | Not Published | Not Published | Not Published | Not Published |
Cornell University
At Cornell University, over the last 25 years, Cornell admitted an average of 4.24% of waitlisted candidates. That figure stood at 3.86% in the previous five years, though it was 6.27% for the most recent Class of 2028 when 388 students earned admission off the list.
Below is a breakdown of Cornell’s waitlist acceptance history:
| Cornell University Class Year | Number of Students Waitlisted to Cornell | Number of Students Who Chose to Join Cornell Waitlist | Number of Students Accepted Off Cornell Waitlist | Cornell Waitlist Acceptance Rate |
| Cornell Class of 2029 | TBD | TBD | TBD | TBD |
| Cornell Class of 2028 | 8,103 | 6190 | 388 | 6.27% |
| Cornell Class of 2027 | 8,282 | 6,166 | 362 | 5.87% |
| Cornell Class of 2026 | 7,729 | 5,531 | 260 | 4.70% |
| Cornell Class of 2025 | 7,746 | 5,800 | 24 | 0.41% |
| Cornell Class of 2024 | 6,750 | 4,791 | 190 | 3.97% |
| Cornell Class of 2023 | 4,948 | 3,362 | 147 | 4.37% |
| Cornell Class of 2022 | 6,683 | 4,546 | 164 | 3.61% |
| Cornell Class of 2021 | 5,714 | 3,723 | 75 | 2.01% |
| Cornell Class of 2020 | 4,571 | 2,874 | 61 | 2.12% |
| Cornell Class of 2019 | 3,583 | 2,231 | 81 | 3.63% |
| Cornell Class of 2018 | 3,143 | 2,026 | 96 | 4.74% |
| Cornell Class of 2017 | 3,144 | 1,966 | 168 | 8.55% |
| Cornell Class of 2016 | 3,098 | 1,941 | 139 | 7.16% |
| Cornell Class of 2015 | 2,982 | 1,846 | 0 | 0% |
| Cornell Class of 2014 | 2,551 | 1,483 | 0 | 0% |
| Cornell Class of 2013 | 3,308 | 1,949 | 0 | 0% |
| Cornell Class of 2012 | 3,444 | 2,163 | 44 | 2.03% |
| Cornell Class of 2011 | 3,213 | 1,976 | 279 | 14.12% |
| Cornell Class of 2010 | 2,713 | 1,746 | 18 | 1.03% |
| Cornell Class of 2009 | 2,643 | 1,544 | 209 | 13.54% |
| Cornell Class of 2008 | 2,411 | 1,988 | 171 | 8.60% |
| Cornell Class of 2007 | 1,983 | 1,682 | 4 | 0.24% |
| Cornell Class of 2006 | 2,373 | 1,942 | 124 | 6.39% |
| Cornell Class of 2005 | 2,131 | 2,116 | 55 | 2.60% |
| Cornell Class of 2004 | 2,131 | 2,116 | 55 | 2.60% |
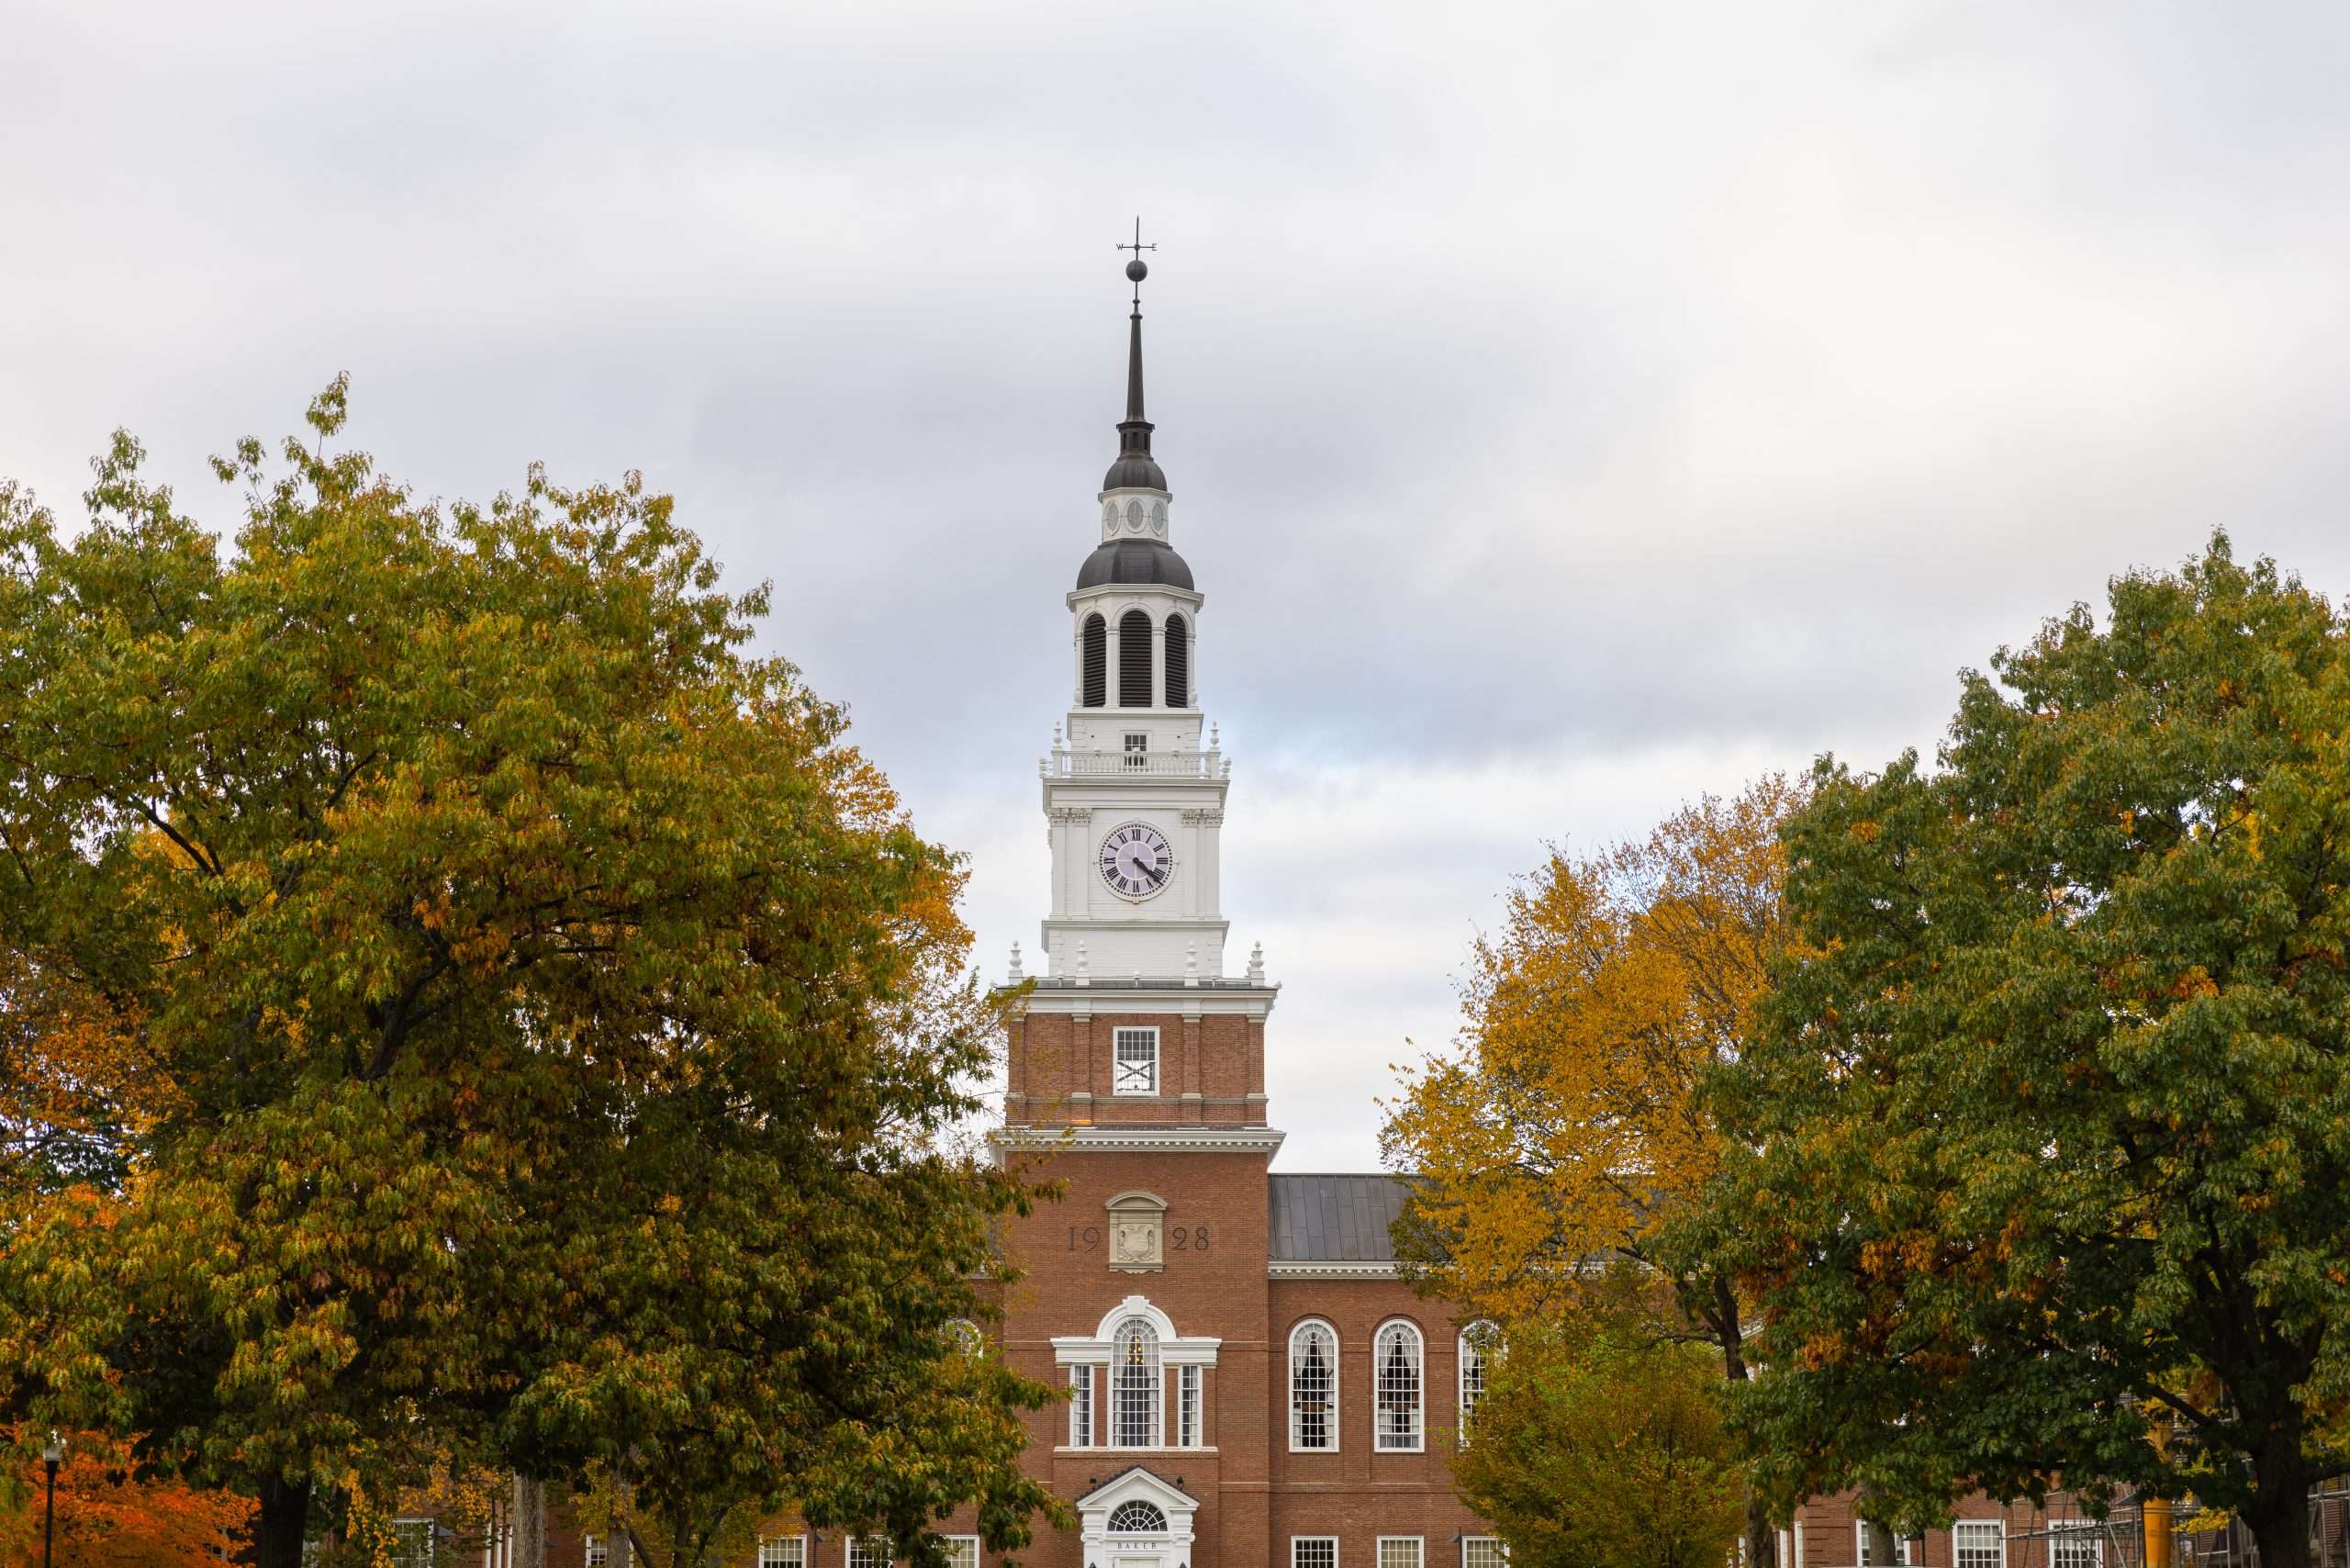
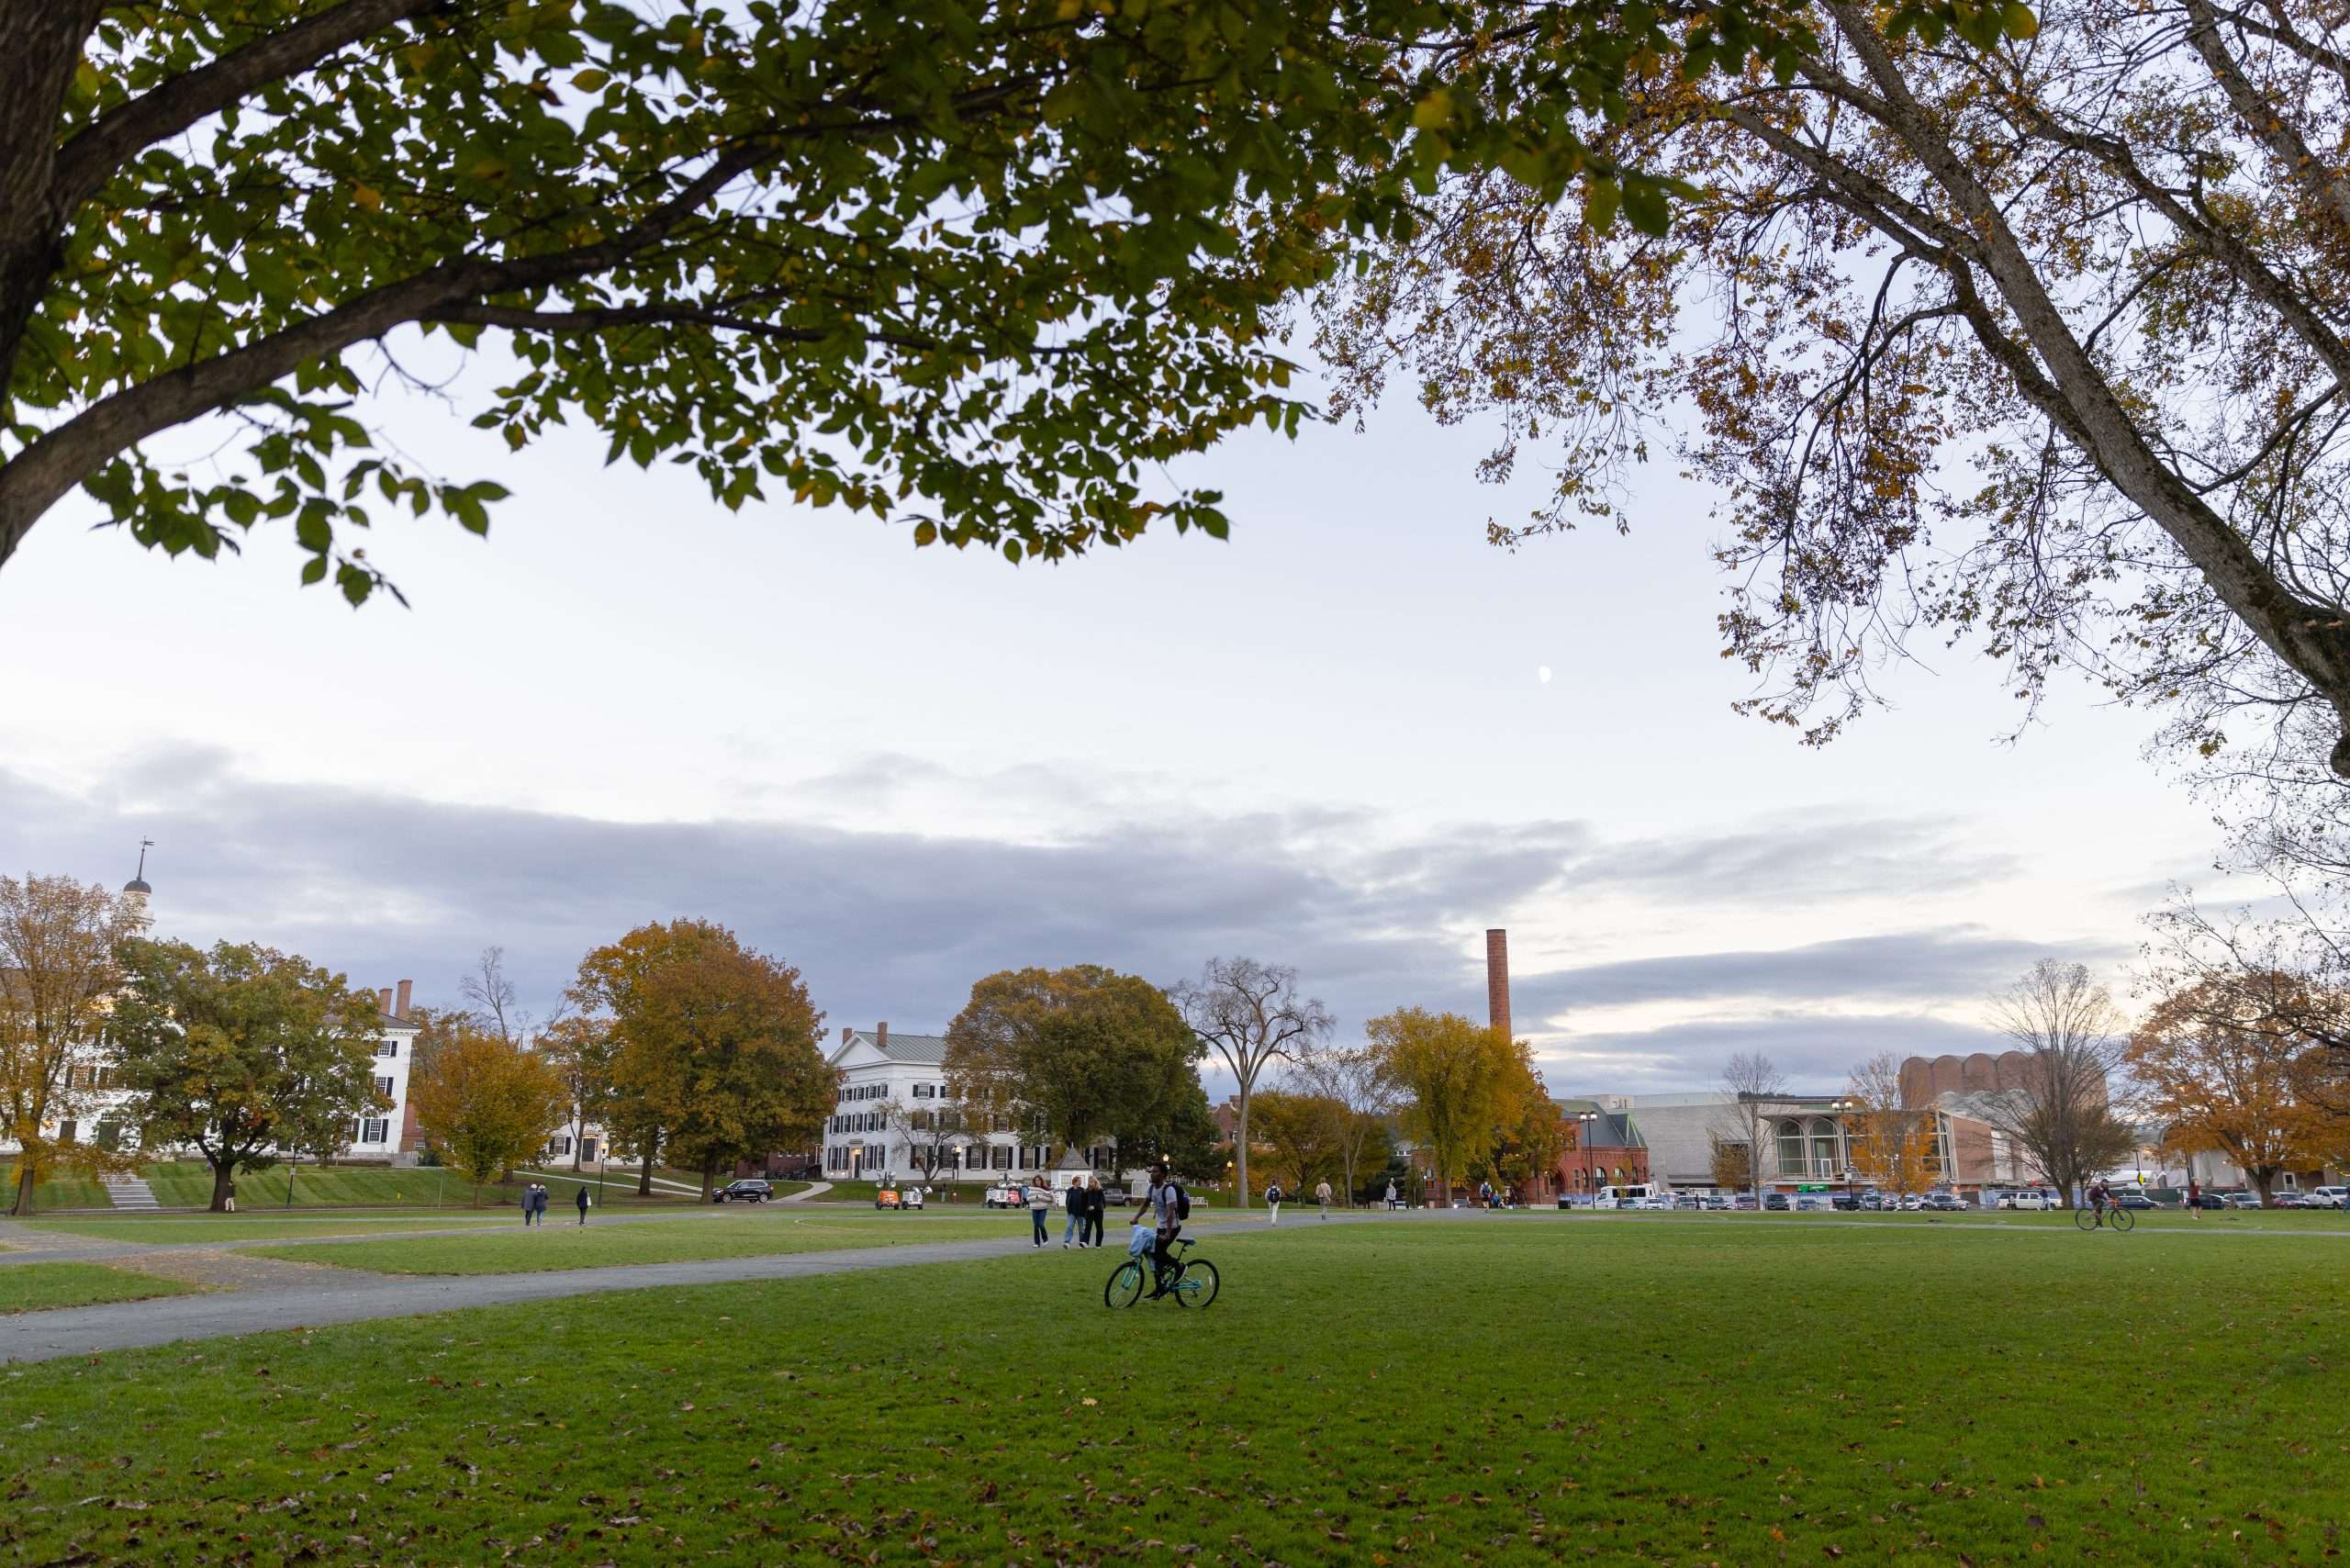
Dartmouth College
Over the previous 21 admissions cycles (from 2024 through 2003), Dartmouth’s average waitlist acceptance rate stands at 4.09%
Below is a breakdown of Dartmouth’s waitlist acceptance history:
| Dartmouth College Class Year | Number of Students Waitlisted to Dartmouth | Number of Students Who Chose to Join Dartmouth Waitlist | Number of Students Accepted Off Dartmouth Waitlist | Dartmouth Waitlist Acceptance Rate |
| Dartmouth Class of 2029 | TBD | TBD | TBD | TBD |
| Dartmouth Class of 2028 | 2,589 | 2,189 | 29 | 1.32% |
| Dartmouth Class of 2027 | 2,352 | 1,606 | 0 | 0% |
| Dartmouth Class of 2026 | 3,933 | 2,753 | 121 | 4.40% |
| Dartmouth Class of 2025 | 2,661 | 1,945 | 95 | 4.88% |
| Dartmouth Class of 2024 | 2,151 | 1,381 | 0 | 0% |
| Dartmouth Class of 2023 | 1,925 | 1,292 | 0 | 0% |
| Dartmouth Class of 2022 | 2,021 | 1,345 | 0 | 0% |
| Dartmouth Class of 2021 | 2,064 | 1,352 | 16 | 1.18% |
| Dartmouth Class of 2020 | 1,852 | 963 | 129 | 13.40% |
| Dartmouth Class of 2019 | 1,855 | 1,133 | 0 | 0% |
| Dartmouth Class of 2018 | 1,691 | 970 | 87 | 8.97% |
| Dartmouth Class of 2017 | 1,736 | 814 | 82 | 10.07% |
| Dartmouth Class of 2016 | 1,983 | 1,047 | 91 | 8.69% |
| Dartmouth Class of 2015 | 1,745 | 1,027 | 25 | 2.43% |
| Dartmouth Class of 2014 | 1,532 | 927 | 81 | 8.74% |
| Dartmouth Class of 2013 | 1,568 | 883 | 41 | 4.64% |
| Dartmouth Class of 2012 | 1,381 | 797 | 0 | 0% |
| Dartmouth Class of 2011 | 1,166 | 669 | 36 | 5.38% |
| Dartmouth Class of 2010 | 1,200 | 700 | 16 | 2.29% |
| Dartmouth Class of 2009 | 1,275 | 790 | 24 | 3.04% |
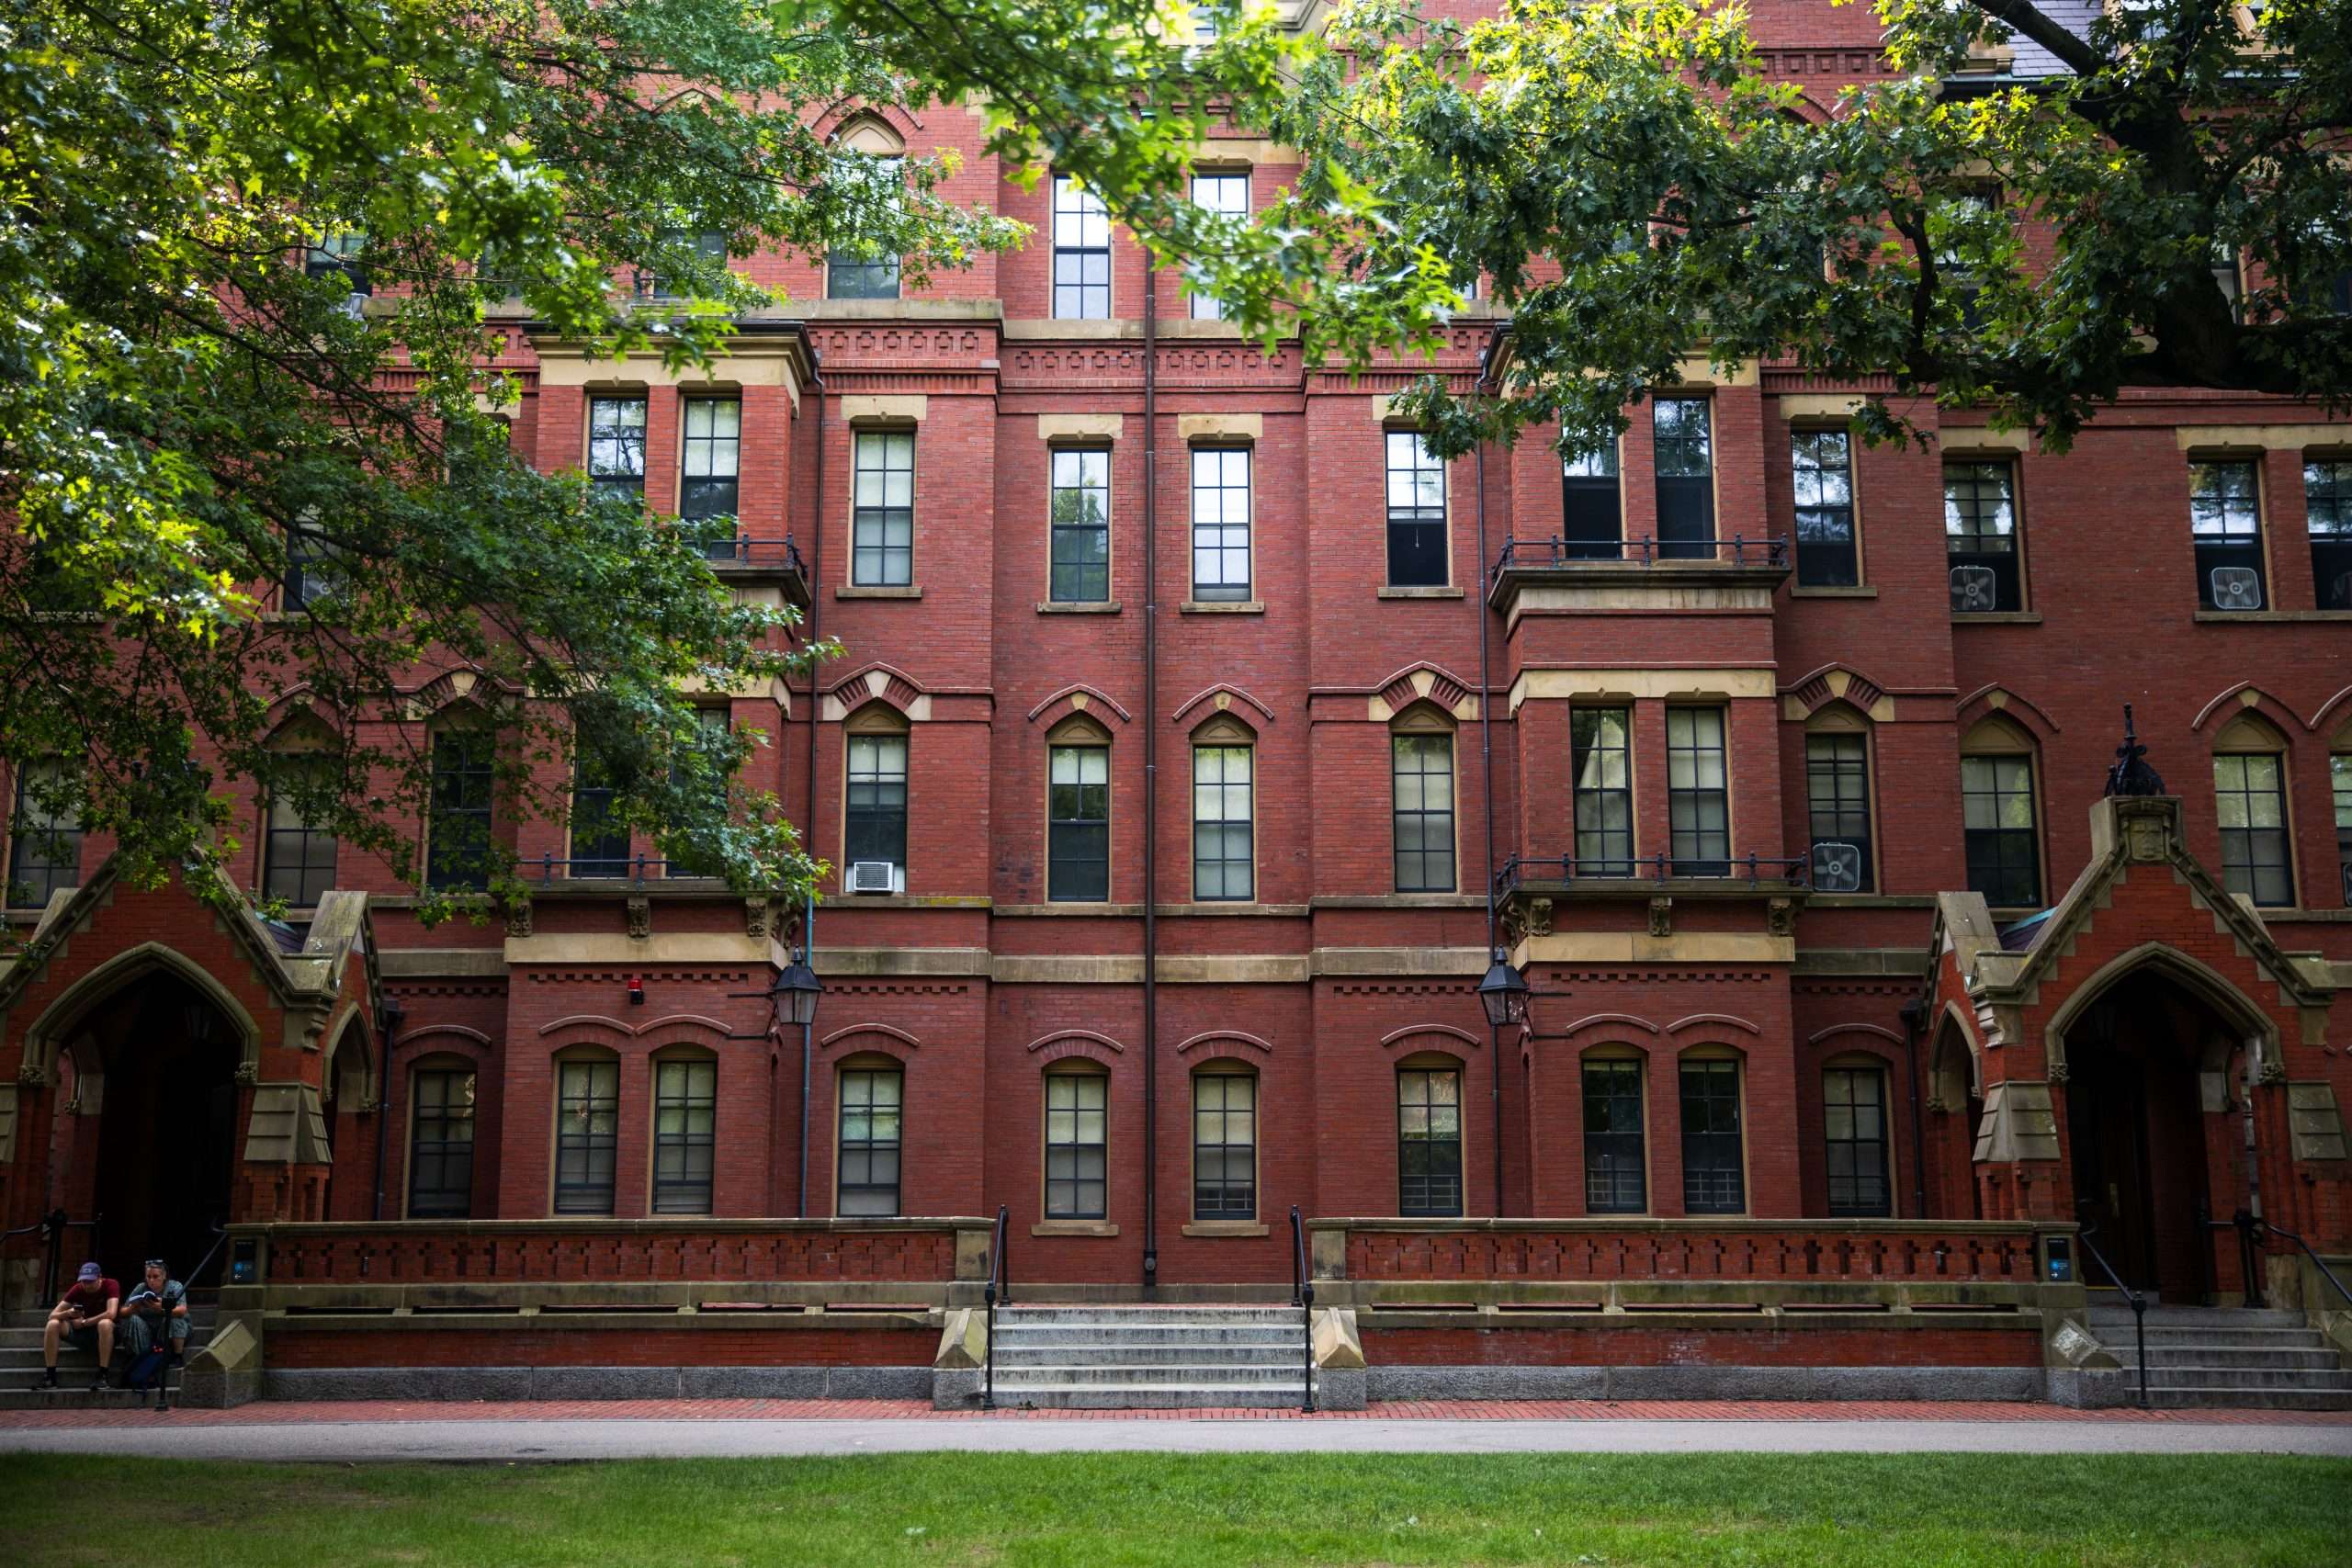
Harvard University
Harvard does not release waitlist admissions statistics. Without the number of students who accept a spot on the Harvard waitlist and the number of students admitted off the waitlist each year, any figure you find online that purports to represent the Harvard waitlist acceptance rate is false — because Harvard neither publicizes these figures nor releases them to The Common Data Set like many other schools.
Instead, it’s pure conjecture, conjecture typically based on Harvard’s yield (the percentage of accepted students who matriculate). In an ordinary year, Harvard’s yield exceeds 80%. For the Harvard Class of 2028, the school’s yield stood at slightly over 83%.
If Harvard’s anticipated yield drops, there’s a very good chance the school will turn to its waiting list. On the other hand, if Harvard’s yield is as anticipated or below expectations, there’s a very good chance the school will offer students admission from the waitlist.
University of Pennsylvania (UPenn)
Penn’s waitlist statistics vary by year, but the school’s waitlist acceptance rate typically ranges between 2-6%. For the Class of 2025, an admissions cycle significantly impacted by the COVID-19 pandemic, nearly 17% of students who opted-in to Penn’s waitlist earned admission, whereas for the Class of 2023, less than 0.5% of students who opted-in to Penn’s waitlisted secured slots.
Below is a breakdown of Penn’s waitlist acceptance history:
| University of Pennsylvania Class Year | Number of Students Waitlisted to UPenn | Number of Students Who Chose to Join UPenn Waitlist | Number of Students Accepted Off UPenn Waitlist | UPenn Waitlist Acceptance Rate |
| UPenn Class of 2029 | TBD | TBD | TBD | TBD |
| UPenn Class of 2028 | 3,010 | 2,288 | 40 | 1.75% |
| UPenn Class of 2027 | 3,351 | 2,508 | 147 | 5.86% |
| UPenn Class of 2026 | 3,933 | 2,753 | 121 | 4.39% |
| UPenn Class of 2025 | 3,205 | 2,350 | 391 | 16.64% |
| UPenn Class of 2024 | 2,932 | 2,051 | 101 | 4.92% |
| UPenn Class of 2023 | 3,535 | 2,561 | 9 | 0.35% |
| UPenn Class of 2022 | 3,458 | 2,327 | 58 | 2.49% |
| UPenn Class of 2021 | Not Reported | Not Reported | Not Reported | Not Reported |
| UPenn Class of 2020 | 2,474 | 1,438 | 90 | 6.26% |
| UPenn Class of 2019 | 2,651 | 1,600 | 36 | 2.25% |
| UPenn Class of 2018 | 2,816 | 1,737 | 44 | 2.53% |
| UPenn Class of 2017 | 2,017 | 1,249 | 87 | 6.97% |
| UPenn Class of 2016 | 2,417 | 1,385 | 56 | 4.04% |
| UPenn Class of 2015 | 3,056 | 1,760 | 55 | 3.13% |
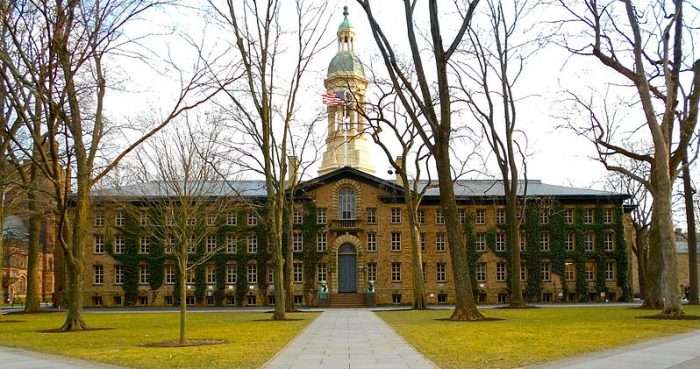
Princeton University
For the 17 years of available data on Princeton’s waitlist that we’ve compiled, Princeton has turned to its waitlist a little over two-thirds of the time.
Over the twelve years in which Princeton has admitted students off its waitlist during this span, which extends from the Class of 2028 through the Class of 2006, the school has admitted a high of 16.37% of waitlisted candidates (the Class of 2015 when 164 waitlisted candidates got in) and a low of 0.15% of waitlisted candidates (the Class of 2024 when one waitlisted candidate got in).
Including the years in which Princeton did not turn to its waitlist over the last 20 years (not counting years in which data is not publicly available), the Ivy League institution admitted an average of 48 waitlisted candidates.
More recently, over the last five admissions cycles, Princeton has been admitting an average of 54 students off the waiting list — higher than the school’s average over two decades. The Class of 2026 in which 150 students (or 15% of waitlisted candidates) and the Class of 2022 in which 101 students (or 12.23% of waitlisted candidates) earned admission off the waitlist marked particularly strong waitlist showings.
Below is a breakdown of Princeton’s waitlist acceptance history:
| Princeton University Class Year | Number of Students Waitlisted to Princeton | Number of Students Who Chose to Join Princeton Waitlist | Number of Students Accepted Off Princeton Waitlist | Princeton Waitlist Acceptance Rate |
| Princeton Class of 2029 | TBD | TBD | TBD | TBD |
| Princeton Class of 2028 | 1,734 | 1,396 | 40 | 2.87% |
| Princeton Class of 2027 | 1,302 | 1,032 | 52 | 5.04% |
| Princeton Class of 2026 | 1,265 | 1,000 | 150 | 15% |
| Princeton Class of 2025 | 820 | 598 | 26 | 4.35% |
| Princeton Class of 2024 | 902 | 668 | 1 | 0.15% |
| Princeton Class of 2023 | 1,125 | 844 | 0 | 0% |
| Princeton Class of 2022 | 1,168 | 826 | 101 | 12.23% |
| Princeton Class of 2021 | 1,237 | 840 | 18 | 2.14% |
| Princeton Class of 2020 | 1,206 | 857 | 39 | 4.55% |
| Princeton Class of 2019 | 1,138 | 818 | 41 | 5.01% |
| Princeton Class of 2018 | 1,395 | 906 | 33 | 3.64% |
| Princeton Class of 2017 | 1,472 | 988 | 0 | 0% |
| Princeton Class of 2016 | Not Published | Not Published | Not Published | Not Published |
| Princeton Class of 2015 | 1,452 | 1,002 | 164 | 16.37% |
| Princeton Class of 2014 | Not Published | Not Published | Not Published | Not Published |
| Princeton Class of 2013 | 1,526 | 1,061 | 148 | 13.95% |
| Princeton Class of 2012 | Not Published | Not Published | Not Published | Not Published |
| Princeton Class of 2011 | 1,216 | 789 | 0 | 0% |
| Princeton Class of 2010 | 1,207 | 794 | 0 | 0% |
| Princeton Class of 2009 | Not Published | Not Published | Not Published | Not Published |
| Princeton Class of 2008 | Not Published | Not Published | Not Published | Not Published |
| Princeton Class of 2007 | Not Reported | Not Reported | Not Reported | Not Reported |
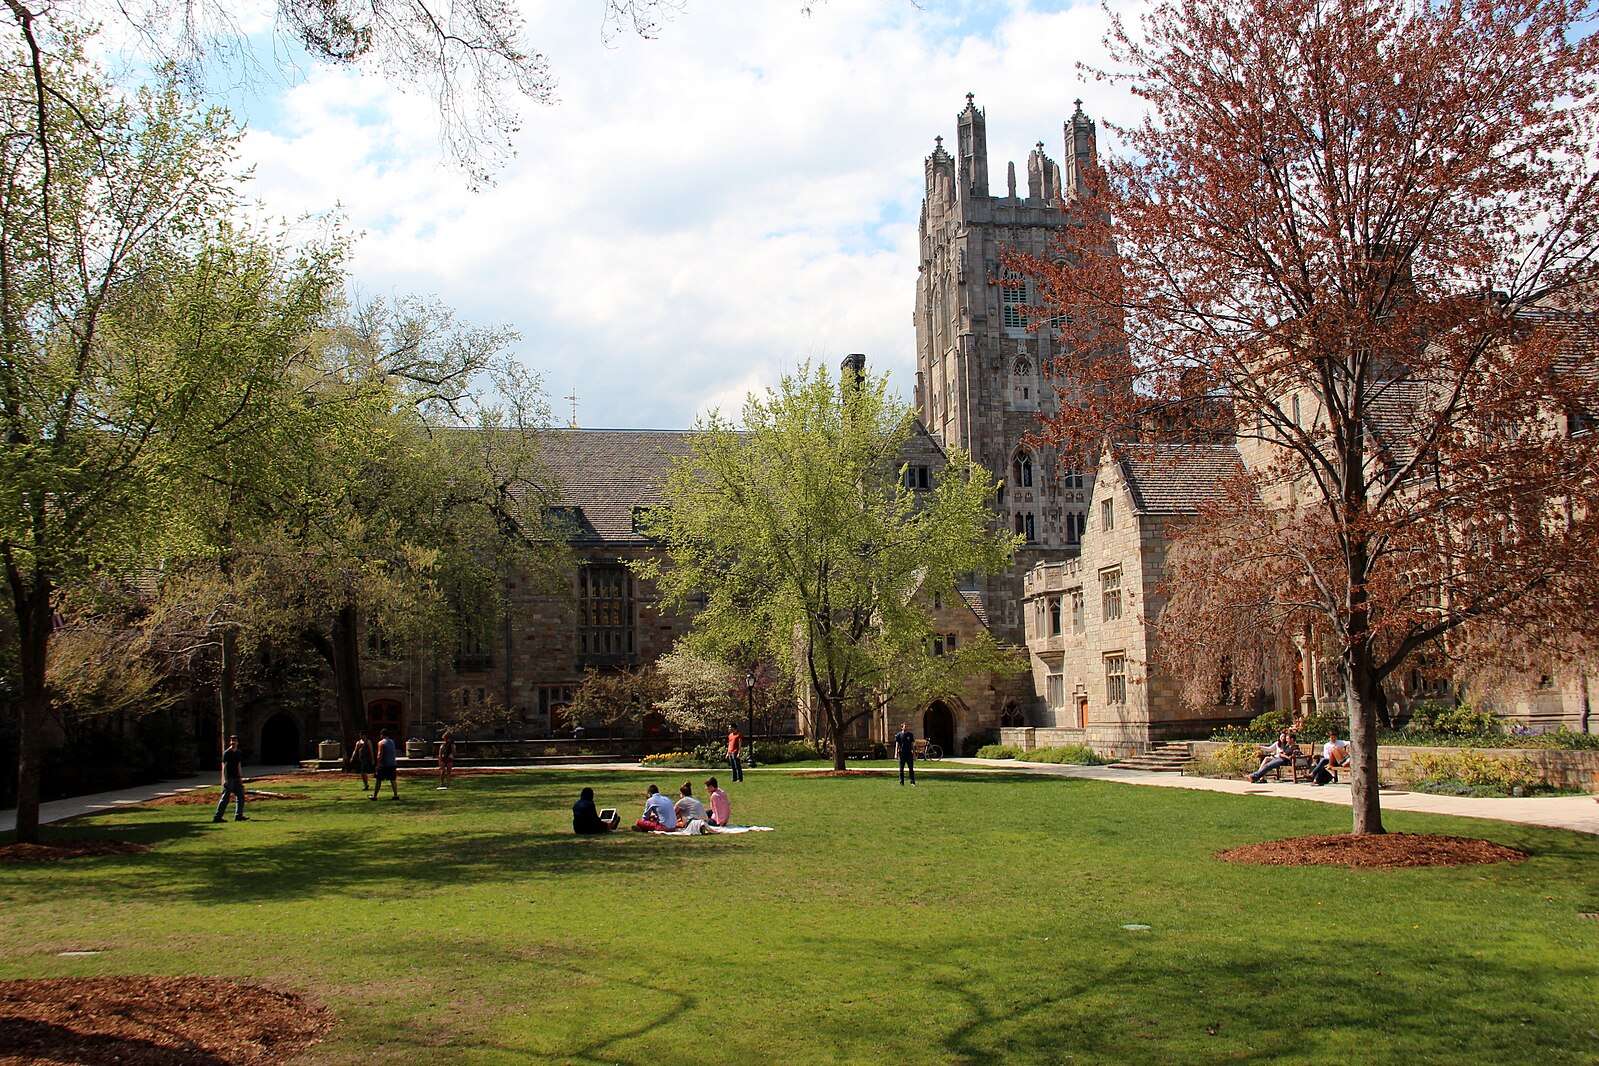
Yale University
Yale’s waitlist reporting is, in a word, inconsistent. The school is more forthright in some years than others.
Below is a breakdown of Yale’s waitlist acceptance history:
| Yale Class Year | Number of Students Waitlisted to Yale | Number of Students Who Chose to Join Yale Waitlist | Number of Students Accepted Off Yale Waitlist | Yale Waitlist Acceptance Rate |
| Yale Class of 2029 | TBD | TBD | TBD | TBD |
| Yale Class of 2028 | 773 | 565 | 23 | 4.07% |
| Yale Class of 2027 | 1,145 | 899 | 0 | 0% |
| Yale Class of 2026 | 1,030 | 774 | 4 | 0.50% |
| Yale Class of 2025 | Not Reported | Not Reported | Not Reported | Not Reported |
| Yale Class of 2024 | Not Reported | Not Reported | Not Reported | Not Reported |
| Yale Class of 2023 | Not Reported | Not Reported | Not Reported | Not Reported |
| Yale Class of 2022 | Not Reported | Not Reported | Not Reported | Not Reported |
| Yale Class of 2021 | 1,095 | 606 | 19 | 3.14% |
| Yale Class of 2020 | 1,098 | 713 | Not Reported | Not Reported |
| Yale Class of 2019 | 1,324 | 837 | Not Reported | Not Reported |
| Yale Class of 2018 | Not Reported | 998 | 42 | 4.43% |
| Yale Class of 2017 | Not Reported | Not Reported | 70 | Not Reported |
| Yale Class of 2016 | Not Reported | Not Reported | 104 | Not Reported |
| Yale Class of 2015 | Not Reported | Not Reported | 98 | Not Reported |
| Yale Class of 2014 | 769 | Not Reported | 7 | Not Reported |
| Yale Class of 2013 | 1,053 | Not Reported | 59 | Not Reported |
Ivy Coach’s Assistance with Ivy League Waitlists
If you’re interested in optimizing your chances of admission off an Ivy League waitlist, fill out Ivy Coach’s complimentary consultation form, indicate that you’ve been waitlisted, and we’ll be in touch to outline our go-forward services for waitlisted candidates. Hint, hint: it’s all about submitting a compelling Letter of Continued Interest that will sway admissions officers to root for you! And, no, an ordinary letter won’t do.
You are permitted to use www.ivycoach.com (including the content of the Blog) for your personal, non-commercial use only. You must not copy, download, print, or otherwise distribute the content on our site without the prior written consent of Ivy Coach, Inc.
Related Articles
Ivy League Graduation Rates
May 17, 2025
Do Ivy Leagues Offer Financial Aid?
May 17, 2025
Harvard’s Yield Rate
May 12, 2025
Notable Dartmouth Alumni
April 22, 2025
Notable Yale Alumni
April 22, 2025
Notable Brown Alumni
April 22, 2025
TOWARD THE CONQUEST OF ADMISSION
If you’re interested in Ivy Coach’s college counseling, fill out our complimentary consultation form and we’ll be in touch.
Get Started