The Ivy Coach Daily
Class of 2027 College Admissions Statistics: A Year in Review
Over the last several days, many of America’s highly selective universities have released admissions notifications for the Regular Decision round for the Class of 2027. So what are the trends? Is this the most competitive year ever in elite college admissions?
Class of 2027 Elite College Admissions Trends
Class of 2027 Admission Rates Are So Far on Par with Class of 2026
While it’s still too early to discern definitive overall trends in application figures and acceptance rates at America’s elite colleges for the Class of 2027 as we await word on the data from the remaining elite schools, it seems as though overall acceptance rates and application figures are on par with last year’s numbers with some schools slightly up and some schools slightly down. And while some schools have set new application benchmarks and all-time low admission rates, most are not earth shattering.
Few Application Surges Like for Class of 2025
For the Class of 2025, applications soared at many of America’s top colleges. At the Massachusetts Institute of Technology, as an example, applications spiked by nearly 66%. But we’re not seeing that sort of data this year for the Class of 2027 thus far. Instead, we’re seeing slight variations (with exceptions, like the University of Southern California, where applications were up 17%). After all, applications can’t soar by 66% every year!
“The Most Competitive Year Ever” is Malarkey
And as to the parents who believe it’s “the most competitive year ever,” well, every applicant pool thinks it’s the most competitive year ever. Feeling as much is food for the soul, especially after students don’t get their desired results. Besides, that distinction belongs to the Class of 2025 since, beyond the soaring applications that year, gap year students from the Class of 2024 filled many of the available seats due to the pandemic.
Finally, even when applications rise at a school and the admission rate drops, it doesn’t mean getting in that particular year is more competitive. For example, more C students applying to Harvard University doesn’t make the Harvard applicant pool more competitive.
Potential Major Changes to Admissions Process Loom with Supreme Court Decision
As we await the final admission rates, we can confidently say that significant changes to the admissions process loom if the United States Supreme Court outlaws Affirmative Action later this year. So while the admissions statistics for the Class of 2027 seem more or less on par with the Class of 2026, change is in the air for the Class of 2028.
Class of 2027 Admission Rates at Elite Universities
Top National University Admissions Statistics
Below are the number of students who applied, the number of students accepted, and the overall admission rate for each of the respective top 25 national universities, as ranked by US News & World Report.
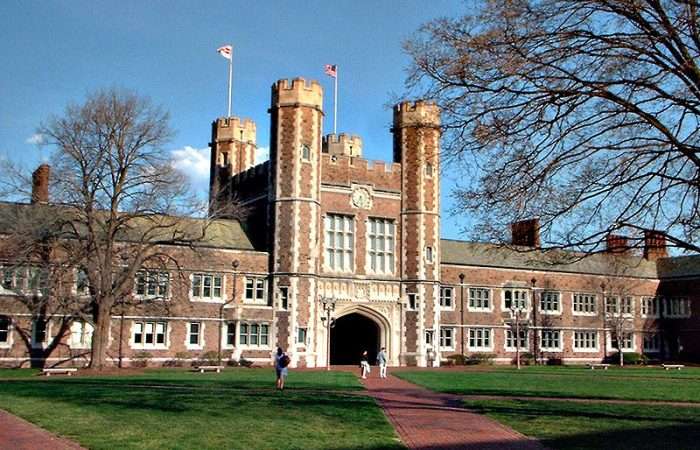
While some top schools, like Princeton University and Washington University in St. Louis, have already released decisions for the Class of 2027, the admission figures are not yet available. The below chart will be updated as the numbers come out. All figures are rounded to the nearest whole number.
| College/University | 2023 US News Rank (“Best National Universities”) | Class of 2027 Total Applications | Class of 2027 Total Admitted | Class of 2027 Overall Admission Rate | Class of 2026 Overall Admission Rate |
| Princeton University | #1 | Not Yet Released | Not Yet Released | Not Yet Released | 4% |
| Massachusetts Institute of Technology | #2 | 26,914 | 1,259 | 5% | 4% |
| Harvard University | #3 | 56,937 | 1,942 | 3.41% | 3% |
| Stanford University | #3 | 56,378 | 2,075 | 3.91% | 4% |
| Yale University | #3 | 52,250 | 2,275 | 4.35% | 4% |
| University of Chicago | #6 | Not Yet Released | Not Yet Released | Not Yet Released | 7% |
| Johns Hopkins University | #7 | 38,200 | 2,403 | 6.29% | 6% |
| University of Pennsylvania | #7 | 59,000+ | Not Yet Released | Not Yet Released | 6% |
| California Institute of Technology | #9 | Not Yet Released | 412 | Not Yet Released | 4% |
| Duke University | #10 | 49,469 | 2,948 | 6% | 6% |
| Northwestern University | #10 | 52,225 | ~3,656 | 7% | 7% |
| Dartmouth College | #12 | 28,841 | 1,751 | 6% | 6% |
| Brown University | #13 | 51,302 | 2,569 | 5% | 5% |
| Vanderbilt University | #13 | 47,120 | 2,645 | 6% | 6% |
| Rice University | #15 | Not Yet Released | Not Yet Released | 8% | 9% |
| Washington University in St. Louis | #15 | Not Yet Released | Not Yet Released | Not Yet Released | 10% |
| Cornell University | #17 | 71,164 | 5,168 | 7.9% | 9% |
| Columbia University | #18 | 57,129 | 2,246 | 4% | 4% |
| University of Notre Dame | #18 | 28,351 | 3,399 | 12% | 13% |
| University of California, Berkeley | #20 | 125,130 | 14,220 | 9% | 11% |
| University of California, Los Angeles | #20 | 145,882 | 12,429 | 11.36% | 9% |
| Carnegie Mellon University | #22 | 34,261 | 3,873 | 11.3% | 11% |
| Emory University | #22 | 33,534 | 5,445 | 16% | 11% |
| Georgetown University | #22 | 26,638 | 3,257 | 12.22% | 12% |
| New York University | #25 | 120,000+ | 9,600 | 8% | 12% |
| University of Michigan – Ann Arbor | #25 | 84,289 | 14,914 | 17.69% | 18% |
| University of Southern California | #25 | 81,000 | 8,000 | 10% | 12% |
| University of Virginia | #25 | 56,439 | 9,184 | 16% | 19% |
Top Liberal Arts College Admission Statistics
Below are the number of students who applied, the number of students accepted, and the overall admission rate for each of the respective top 25 liberal arts colleges, as ranked by US News & World Report.
While some top liberal arts schools, like Vassar College, have already released decisions for the Class of 2027, the admission figures are not yet available. The below chart will be updated as the numbers come out. All figures are rounded to the nearest whole number.
| College/University | 2023 US News Rank (“Best Liberal Arts Colleges”) | Class of 2027 Total Applications | Class of 2027 Total Admitted | Class of 2027 Overall Admission Rate | Class of 2026 Overall Admission Rate |
| Williams College | #1 | 11,462 | 1,144 | 10% | 9% |
| Amherst College | #2 | 12,700 | 1,143 | 9% | 7% |
| Pomona College | #3 | 12,121 | 819 | 6.75% | 7% |
| Swarthmore College | #4 | 14,287 | 969 | 7% | 7% |
| Wellesley College | #5 | 8,400 | 1,092 | 13% | 13% |
| Bowdoin College | #6 | 10,966 | 850 | 8% | 9% |
| Carleton College | #6 | Not Yet Published | Not Yet Published | 22% | 17% |
| Claremont McKenna College | #9 | 5,638 | 627 | 11.12% | 10% |
| Middlebury College | #11 | 13,297 | Not Yet Published | 11% | 15% |
| Washington and Lee University | #11 | 6,820 | 1,184 | 17.36% | 19% |
| Smith College | #13 | 9,868 | ~1,875 | 19% | 23% |
| Vassar College | #13 | 12,145 | 2,153 | 17.73% | 19% |
| Davidson College | #15 | 7,347 | 1,064 | 14.48% | 17% |
| Grinnell College | #15 | Not Yet Published | Not Yet Published | Not Yet Published | 9% |
| Hamilton College | #15 | 9,643 | 1,135 | 11.77% | 12% |
| Barnard College | #18 | 11,803 | ~767 | 7% | 8% |
| Colgate University | #18 | 21,114 | Not Yet Published | 12% | 12% |
| Haverford College | #18 | 6,391 | 825 | 12.91% | 14% |
| University of Richmond | #18 | 15,757 | 3,467 | 22% | 24% |
| Wesleyan University | #18 | 14,500 | 2,479 | 17.1% | 14% |
| Colby College | #24 | ~17,800 | 1,142 | 6% | 7% |
| Bates College | #25 | 9,076 | 1,185 | 13.06% | 13% |
Ivy Coach’s Assistance with Optimizing Waitlist Chances
If your child was waitlisted to a college they hope to earn admission to, fill out Ivy Coach’s free consultation form, indicate they’ve been waitlisted, and we’ll promptly contact you. They need to submit a powerful Letter of Continued Interest. An ordinary letter won’t do.
You are permitted to use www.ivycoach.com (including the content of the Blog) for your personal, non-commercial use only. You must not copy, download, print, or otherwise distribute the content on our site without the prior written consent of Ivy Coach, Inc.
Related Articles

Tufts University Class of 2029 Admissions Statistics
May 13, 2025

Colby College Waitlist Acceptance Rate
May 13, 2025
Bates College Waitlist Acceptance Rate
May 6, 2025

Haverford College Waitlist Acceptance Rate
May 6, 2025

UConn Waitlist Acceptance Rate
May 6, 2025
TOWARD THE CONQUEST OF ADMISSION
If you’re interested in Ivy Coach’s college counseling, fill out our complimentary consultation form and we’ll be in touch.
Get Started